|
9C A distance-time graph shows how the distance of an object changes with time. Experiment: Students placed 5 metres apart outside with a stopwatch. One student (let's call her Emma) starts a journey and everyone starts their stopwatch. When Emma passes each student in turn they stop their stopwatch. The results are then plotted on a distance-time graph. Summary of distance-time graphs: 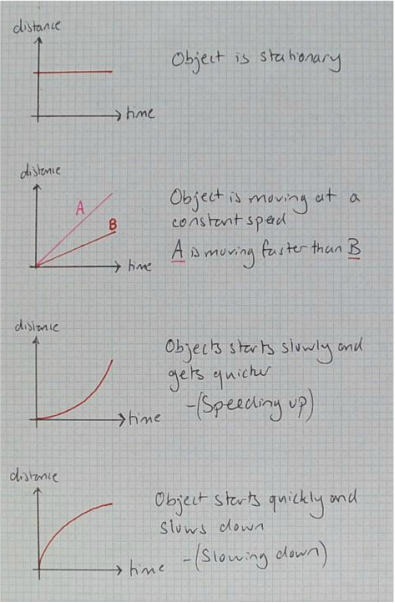 Worksheet on distance-time graphs found here
|
ArchivesCategories |
 RSS Feed
